


“Years of tectonic plate folding, RUINED! 🙄”

3 public comments

Levers are just as absurd, as Archimedes points out: give me a lever long enough and a fulcrum on which to place it, and I shall move the world.
Silicon Valley, CA

That video is great, thanks! Science!
Lexington, KY; Naples, FL


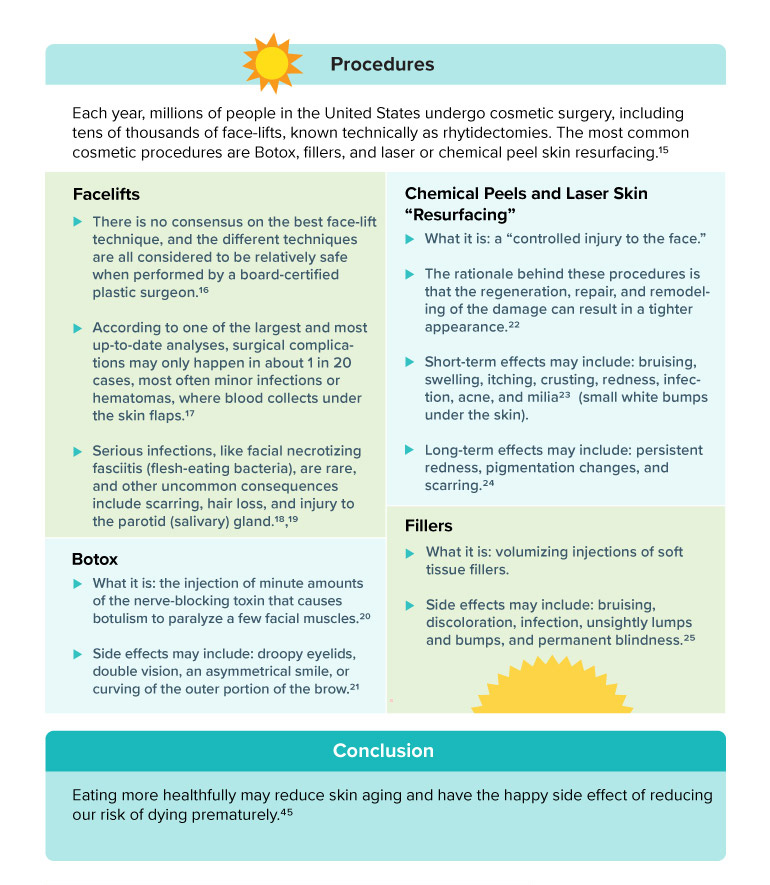
When I dove into the scientific research for my book How Not to Age, I uncovered the best ways we can care for our skin as we mature. What are the most important lifestyle factors? The best topical creams? Are there any beneficial procedures? This infographic summarizes the main takeaways.


Get this infographic as a downloadable PDF with citations here.
For more details about the studies referenced in this infographic, watch the related videos for free on NutritionFacts.org’s YouTube channel or on our website’s Anti-aging topic page.
I have never heard of "topical retinoids" before but "risk of dying prematurely" is oddly vague

The last several posts have been looking at the bifurcation diagram below in slices.
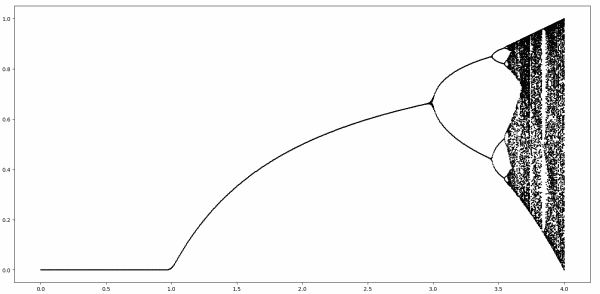
The first post looked at the simple part, corresponding to the horizontal axis r running from 0 to 3.
The next post looked at the first fork, for r between 3 and 3.4495.
The previous post looked at the period doubling region, for r between 3.4495 and 3.56995.
For r greater than about 3.56995 we enter the chaotic region. This post looks at an apparent island of stability inside the chaotic region. This island starts at r = 1 + √8 = 3.8284.
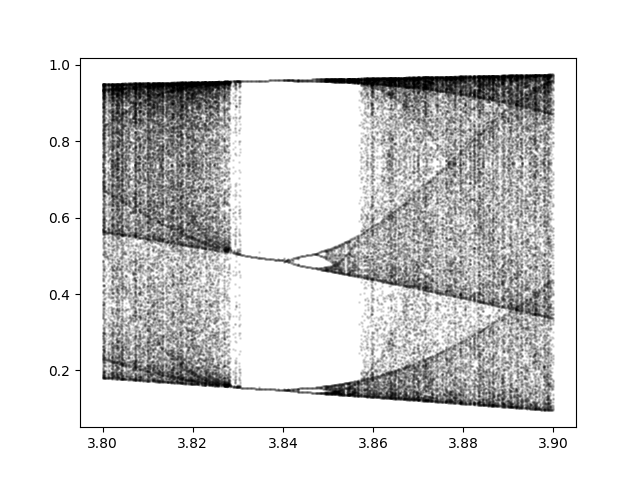
The whitespace indicates an absence of stable cycle points. There are unstable cycle points, infinitely many in fact, as we will soon see. For a small range of r there are three stable cycle points. When r = 3.83, for exampel, the three cycle points are 0.1561, 0.5047, and 0.9574.
This is significant because period three implies chaos. There is a remarkable theorem that says if a continuous map of a bounded interval to itself has a point with period 3, then it also has points with periods 4, 5, 6, … as well as an uncountable number of points with no period. If there are points with period 4, why can’t we see them? Because they’re unstable. You would have to land exactly on one of these points to go in a cycle. If you’re off by the tiniest amount, which you always are in computer arithmetic, you won’t stay in the cycle.
So even when we’re in the region with three stable points, things are still technically chaotic.
There seems to be something paradoxical about computer demonstrations of chaos. If you have extremely sensitive dependence on initial conditions, how can floating point operations, which are not exact, demonstrate chaos? I would say they can illustrate chaos rather than demonstrate chaos. And sometimes you can do computer calculations which do not have such sensitivity to show that other things are sensitive.
For example, I asserted above that there are points with period 4. Let f be the logistic map with r = 3.83
f(x) = 3.83 x(1 − x)
and define
p(x) = f(f(f(f(x)))),
i.e. four applications of f. Then you can see that there must be a point with period 4 because the graph of p(x) crosses the graph of x.
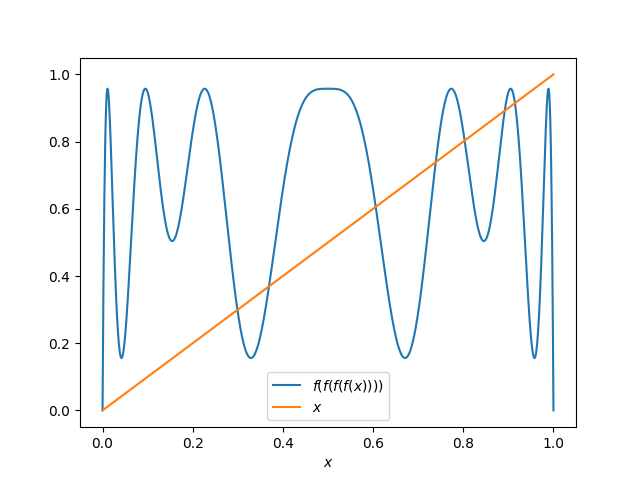
So while our region of whitespace appears to be empty except for three stable cycle points, there are infinitely many more cyclic points scattered like invisible dust in the region, a set of measure zero that we cannot see.
The post An island of stability in a sea of chaos first appeared on John D. Cook.
I'm really enjoying this series despite having zero clues what the insights would be relevant for
I recently ran into Recamán’s sequence. N. J. A. Sloane, the founder of the Online Encyclopedia of Integer Sequences calls Recamán’s sequence one of his favorites. It’s sequence A005132 in the OEIS.
This sequence starts at 0 and the nth number in the sequence is the result of moving forward or backward n steps from the previous number. You are allowed to move backward if the result is positive and a number you haven’t already visited. Otherwise you move forward.
Here’s Python code to generate the first N elements of the sequence.
    def recaman(N):
        a = [0]*N
        for n in range(1, N):
            proposal = a[n-1] - n
            if proposal > 0 and proposal not in set(a):
                a[n] = proposal
            else:
                a[n] = a[n-1] + n
        return a
For example, recaman(10) returns
[0, 1, 3, 6, 2, 7, 13, 20, 12, 21]
There’s a Numberphile video that does two interesting things with the sequence: it visualizes the sequence and plays a representation of the sequence as music.
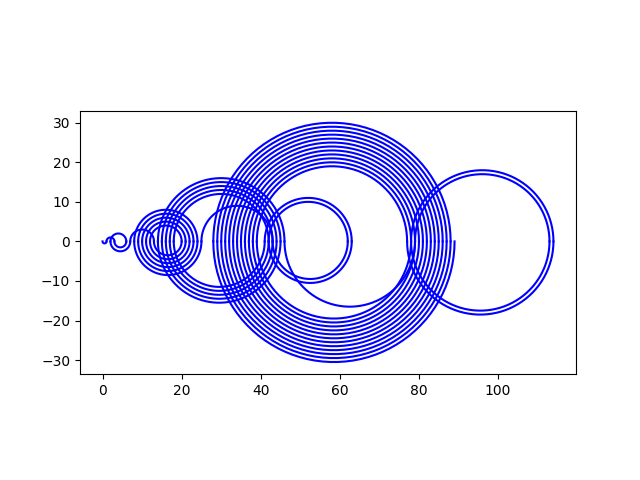
The rules for the visualization are that you connect consecutive elements of the sequence with circular arcs, alternating arcs above and below the numberline.
Here’s code to reproduce an image from the video.
    import numpy as np
    import matplotlib.pyplot as plt

    def draw_arc(a, b, n):
        c = (a + b)/2
        r = max(a, b) - c
        t = np.linspace(0, np.pi) * (-1)**(n+1)
        plt.plot(c + r*np.cos(t), r*np.sin(t), 'b')

    N = 62
    a = recaman(N)
    for n in range(N-1):
        draw_arc(a[n], a[n+1], n)
    plt.gca().set_aspect("equal")
    plt.show()
Here’s the output:
To create a music sequence, associate the number n with the nth note of the chromatic scale. You can listen to the music in the video; here’s sheet music made with Lilypond.

Update
Here is another Recamán visualization going further out in the sequence. I made a few aesthetic changes at the same time.
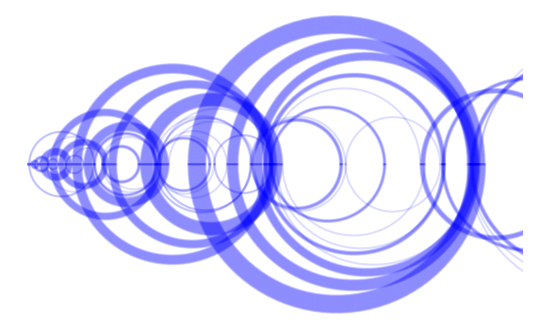
I’ve also made higher resolution versions of the images in this post. Here are SVG and PDF versions of the first visualization.
Here is a PDF of the sheet music.
And here are SVG and PDF versions of the new visualization.
The post Recamán’s sequence first appeared on John D. Cook.

I have luckily/sadly only once in my life had a project where I had to resort to making sticky note chains by sticking the next sticky note onto the previous one (in front-back alternating fashion) and folding them like an accordeon
 ALT
ALTA recent New Scientist cartoon 🍄 #fungi
Oh, is that why Mario and Peach still don't have kids after all these years?
Next Page of Stories